Preventive Maintenance: How to Move From Reactive to Planned
Every facility team says it wants to be proactive. Most measure nothing, schedule from memory, and discover in year three that the chiller they never opened has been running on one compressor since spring. This is a working guide to the transition, with the numbers that tell you whether it is happening.
What is preventive maintenance?
Preventive maintenance is work done to an asset on a schedule, before it fails, to reduce the chance that it does. It is defined by its trigger, not by its content: the same filter change is preventive when the calendar asks for it and corrective when a complaint does.
Three triggers exist, and most estates need all three:
- Time-based. Every 30, 90 or 365 days. Simple, auditable, and wasteful when the interval is wrong.
- Meter-based. Every 500 running hours, every 10,000 cycles. Matches wear to use, and requires a reading somebody actually takes.
- Condition-based. Triggered by a measurement: vibration, temperature, pressure differential, current draw. The most efficient and the most demanding to run.
A programme that is entirely time-based is not wrong. It is where nearly everyone starts, and it is a large improvement on nothing.
What is the right ratio of planned to reactive work?
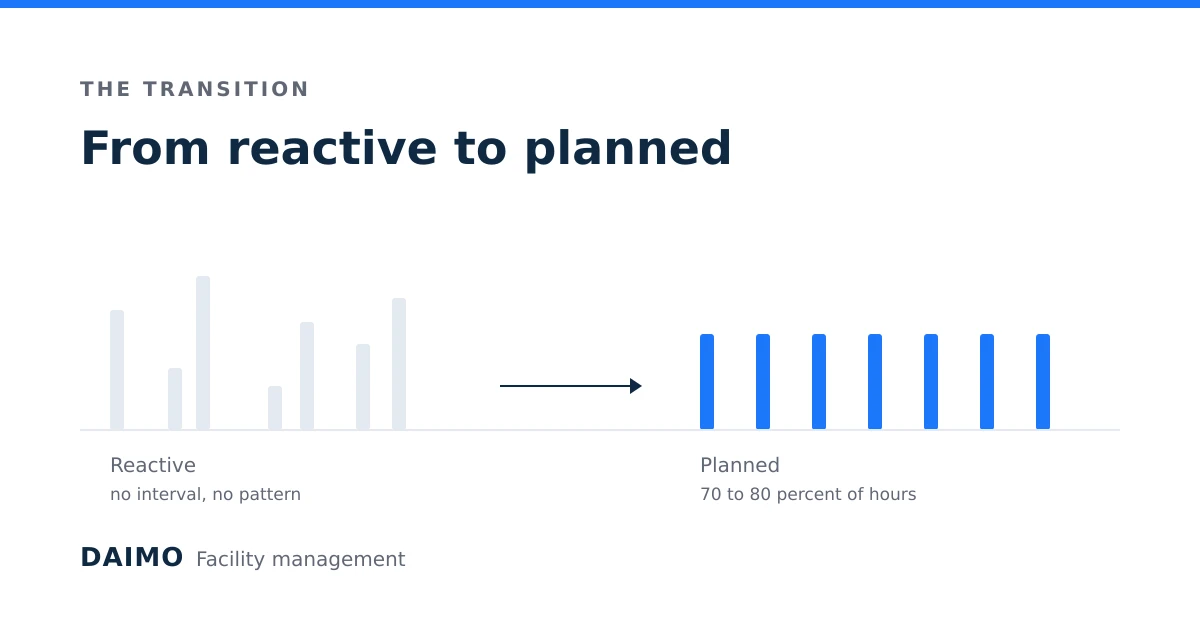
A commonly cited target in maintenance practice is that 70 to 80 percent of maintenance labour hours should go to planned work. Most operations that have never measured it discover they are between 20 and 40 percent.
The ratio matters because it is the only figure that captures the whole system in one number. Reactive work is more expensive per job than planned work for reasons that compound: overtime rates, emergency parts pricing, a technician travelling to one site for one job rather than batching, the collateral damage of running to failure, and the production or occupancy lost while it is down.
Do not chase the ratio directly. It is an outcome. If you raise it by cancelling emergency work you have not improved anything, you have only stopped recording it.
One caution about measuring it: count hours, not tickets. A programme with two hundred ten-minute filter checks and forty half-day breakdowns looks excellent by ticket count and is failing.
How do you build a PPM schedule that survives contact with reality?
The schedule that fails is the one built in a spreadsheet by one person in one week. The schedule that holds is built in this order.
1. Start from the asset register, not from the tasks. If the asset is not on the register, its maintenance is not in the plan, and no amount of scheduling fixes that. This is the same reason asset registers are the whole of a CAFM implementation.
2. Take intervals from the manufacturer first. The manual is the defensible starting point, and it is what a warranty claim or an insurance assessment will be measured against. Where you use a standard schedule library, that is your second source.
3. Adjust for how the asset is actually used. A manufacturer's interval assumes a duty cycle. An air handling unit in Riyadh in August is not doing what the manual assumed. Dust loading, run hours and ambient temperature all move the correct interval, usually shorter.
4. Level the workload across the year. A schedule that is mathematically correct and puts 60 percent of the year's work in two months will not be completed. Spread it. Then look at the peak week and ask whether your actual team can do it, including holidays.
5. Write the checklist with the technician who will use it. A task that reads "inspect pump" produces a tick. A task that reads "record suction and discharge pressure, note any seal weep, photograph the coupling guard" produces data you can act on next year.
6. Review after one full cycle. Every interval you set was a guess. After a year you have evidence: which inspections never found anything, and which assets failed between visits. Both are instructions.
Time, meter or condition: which should you use?
| Trigger | Best for | Cost to run | The trap |
|---|---|---|---|
| Time-based | Assets with predictable wear, statutory inspections, anything where evidence of regularity matters | Low | Intervals copied from a manual and never revisited |
| Meter-based | Generators, pumps, vehicles, lifts, anything where use varies a lot between units | Medium: someone must capture readings | Readings entered from memory at month end, which is worse than no readings |
| Condition-based | High-value or high-consequence assets where failure is expensive | High: needs instruments and someone who can read them | Data nobody reviews. An alert with no owner is not a control |
The sensible progression is time-based for everything, meter-based for the assets whose use varies, condition-based for the few where failure is genuinely expensive. Attempting condition-based monitoring across an entire estate on day one is the most common way to spend a large budget and change nothing.
Why do preventive maintenance programmes fail?
Five reasons, in the order they actually occur.
The asset register is wrong. Work is scheduled against assets that were replaced, moved or never existed, and technicians learn that half the job list is fiction. Once they believe that, they stop trusting all of it.
The schedule was never levelled. Completion rates collapse in the peak months and never recover, because the backlog rolls forward into a month that was already full.
Completion is measured by ticking, not by evidence. If closing a task requires no reading, no photograph and no measurement, you are collecting confirmations rather than data. The programme will look excellent right up until the failure.
Nobody owns the exceptions. A skipped task needs a name attached to it and a reason, reviewed by someone. Without that, skipping is free, and free things increase.
It is invisible to whoever funds it. Preventive maintenance is a cost centre that prevents costs nobody sees. If you cannot show the finance director a number, the budget is a candidate for cutting every single year.
The fifth one is why the measurement section below is not optional.
What should the technician actually see?
The economics of a PPM programme are decided in the ninety seconds a technician spends at the asset. Four things make the difference between data and ticks.
The asset identified without searching. A QR code or barcode on the equipment that opens its record. Searching a list on a phone in a plant room is how jobs get closed against the wrong asset.
The history, on the same screen. What was found last time, and the time before. A technician who can see that the same bearing temperature has climbed for three visits will say something. One who cannot, will not.
A checklist with fields, not checkboxes. Readings, photographs, a free-text note. The checklist is the data collection instrument. Treat it that way.
Offline capability. Plant rooms, basements, roofs and lift shafts do not have signal. If the app requires connectivity, the work is recorded later from memory, and everything above is lost.
Which numbers tell you it is working?
Five, reviewed monthly. Baseline them before you change anything, because the starting number is the only proof you will ever have that something moved.
- Planned work percentage. Planned labour hours divided by total labour hours. The headline number.
- PPM completion rate. Scheduled tasks completed within their window, as a share of those due. Below 85 percent the schedule is not real. Measure within the window, not eventually, or the number means nothing.
- Reactive work order volume, by asset. Not the total. The distribution. A short list of assets almost always generates a long tail of emergencies, and that list is your capital replacement plan.
- Mean time to repair. Request to verified completion for a defined class of fault. Improves when planning improves, because parts are on the shelf.
- Maintenance cost per square metre, or per asset class. The number that translates the four above into the language the budget is written in.
One number that looks useful and is not: total work orders closed. It rises when things are going well and rises when things are going badly.
A 90 day plan from reactive to planned
Days 1 to 30: measure and register. Baseline the five numbers, even roughly. Walk the sites and correct the asset register for the critical assets, which in most estates is 15 to 20 percent of the count and 80 percent of the risk. Do not schedule anything yet.
Days 31 to 60: schedule the critical assets only. Build PPM for that critical list, with real checklists and levelled across the year. Resist the urge to cover everything. A programme covering 20 percent of assets and completing at 95 percent beats one covering everything at 40 percent, and it beats it on every metric.
Days 61 to 90: close the loop. Exceptions reviewed weekly with names attached. The five numbers reported monthly to whoever owns the budget. Then extend coverage to the next tier of assets, and keep extending only as fast as completion stays above 85 percent.
The discipline that makes this work is the last clause. Coverage that outruns completion is how a programme becomes fiction, and a programme nobody believes is harder to fix than one that never started.
Common questions
How much preventive maintenance is too much? When the cost of the inspection exceeds the expected cost of the failure it prevents, over the same period. In practice, if an inspection has found nothing for three consecutive years on a non-critical, non-statutory asset, lengthen the interval and see what happens. Statutory and safety-critical inspections are not subject to this reasoning.
Should we do this in-house or with a contractor? Either works. The thing that must stay in-house is the asset register and the schedule. A contractor who owns your maintenance data owns your ability to change contractor.
How do we handle assets we inherited with no history? Start the history now. Record condition at first visit as the baseline, set a conservative interval, and revise after one cycle. Waiting for complete information is how estates go another year with no data at all.
What does DAIMO do here? DAIMO generates work orders from schedules attached to assets, on interval or on meter reading, with the checklist the technician follows on a phone that works offline and syncs when it reconnects. Parts consumed, labour hours and contractor invoices accumulate against the asset, so the planned versus reactive ratio, the completion rate and the cost per asset are queries rather than a month-end reconstruction. The asset register carries QR codes, which is the part that decides whether any of it gets recorded at the equipment or at a desk three hours later.